Egyptians quarried limestone, granite, and copper ores, while Mesopotamians bitumen and various stones, forming the earliest documented practical engagement with Earth materials and mineral resources. · Wikipedia: https://en.wikipedia.org/wiki/History_of_geology
Identifier: philtrans01784772 (find matches) Title: An Account of the Eruption of Mount Vesuvius, in 1767: In a Letter to the Earl of Morton, President of the Royal Society, from the Honourable William Hamilton, His Majesty's Envoy Extraordinary at Naples Year: 1768 (1760s) Authors: Hamilton, W. Subjects: Proceedings of the Royal Society of London Philosophical Transactions of the Royal Society Publisher: Royal Society of London View Book Page: Book Viewer About This Book: Catalog Entry View All Images: All Images From Book Click here to view book online to see this illustration in context in a browseable online version of this book. Text Appearing Before Image: cf. i/^mg,^-^7^2^/.zfw.iyai!$._2z:y!)./^. Text Appearing After Image: ' Note About Images Please note that these images are extracted from scanned page images that may have been digitally enhanced for readability - coloration and appearance of these illustrations may not perfectly resemble the original work. By Hamilton, W. - https://www.flickr.com/photos/internetarchivebookimages/14744451476/ Source book page: https://archive.org/stream/philtrans01784772/01784772#page/n26/mode/1up, No restrictions, https://commons.wikimedia.org/w/index.php?curid=43950485
300 BCE
Kautilya's Arthashastra on mining
The ancient Indian political treatise Arthashastra detailed state administration of mines, metallurgy, and mineral resources including gold, silver, copper, iron, and salt, reflecting advanced practical mining knowledge. Source — Wikipedia:
250 BCE
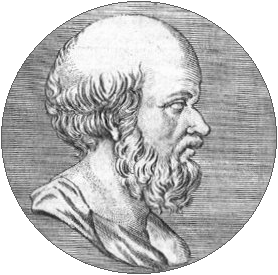
Eratosthenes measures Earth's circumference
Greek scholar Eratosthenes estimated Earth's circumference using shadow angles at Alexandria and Syene, achieving remarkable accuracy and founding geodesy. Source — Wikipedia:
Eratosthenes measures Earth's circumference By Unknown author, Public domain, https://commons.wikimedia.org/w/index.php?curid=494949Video
77 CE
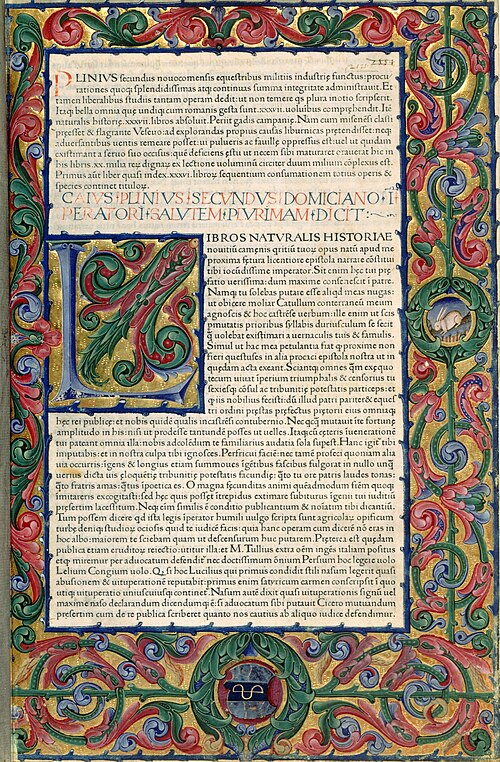
Pliny the Elder records natural history
Pliny the Elder's Naturalis Historia compiled knowledge of minerals, metals, stones, and volcanoes, including an eyewitness description of Vesuvius, serving as a geoscience reference for centuries. Source — Wikipedia: )
First page from the Editio Princeps of the Pliny's "Historia Naturalis" printed by Johann of Speyer. Venice, 1469. Bibliothèque Nationale de France, Réserve des livres rares, VELINS-493 By Pliny the Elder - https://essentiels.bnf.fr/fr/image/2512ab77-3dca-4aa2-809e-0441c8ad777c-historia-naturalis, Public domain, https://commons.wikimedia.org/w/index.php?curid=142196397
132 CE
Zhang Heng invents the seismoscope
Chinese polymath Zhang Heng invented the world's first seismoscope, a bronze vessel that detected the direction of distant earthquakes, founding instrumental seismology. Source — Wikipedia:
Tomb of Zhang Heng By Windmemories - Own work, CC BY-SA 4.0, https://commons.wikimedia.org/w/index.php?curid=176246974
224 CE
Pei Xiu establishes cartographic grid
Chinese cartographer Pei Xiu systematized mapmaking using a rectangular grid coordinate system, advancing spatial representation of terrain and becoming a foundational figure in geographic science. Source — Wikipedia:
1010 CE
Ibn Sina describes mountain formation
Persian polymath Ibn Sina (Avicenna) wrote on the formation of mountains, rock strata, and fossils, arguing that mountains arose from earthquakes and sedimentary processes over long timescales. Source — Wikipedia:
Format: Still image Genre(s): Portraits Abstract: Bust, left profile. Extent: 1 photomechanical reproduction Technique: halftone, color NLM Unique ID: 101408284 NLM Image ID: B029612 Permanent Link: resource.nlm.nih.gov/101408284 By National Library of Medicine - https://www.flickr.com/photos/nlmhmd/54093321223/, No restrictions, https://commons.wikimedia.org/w/index.php?curid=168831766
1030 CE
Al-Biruni measures Earth's radius
Persian scholar al-Biruni calculated Earth's radius using trigonometric observations from a mountain in Punjab, achieving unprecedented accuracy and advancing geodesy. Source — Wikipedia:
USSR stamp, Abū Rayhān al-Bīrūnī, 6 copecks, 1973. By The original uploader was Romanm at Slovenian Wikipedia. - Originally from sl.wikipedia; description page is/was here., Public domain, https://commons.wikimedia.org/w/index.php?curid=2590841
1088 CE
Shen Kuo's Dream Pool Essays
Chinese scholar Shen Kuo described fossilized bamboo as evidence of past climate change, proposed marine origins of land formations, and documented magnetic compass declination. Source — Wikipedia:
Portrait sketch of Shen Kuo By Unknown 18th century artist - http://www-history.mcs.st-andrews.ac.uk/PictDisplay/Shen_Kua.html, Public domain, https://commons.wikimedia.org/w/index.php?curid=6551589
Jan 23, 1556 CE
Shaanxi earthquake deadliest on record
The Shaanxi earthquake killed approximately 830,000 people in China, motivating detailed official earthquake record-keeping and advancing the study of seismic hazards. Source — Wikipedia:
Shaanxi earthquake deadliest on record By Unknown author, CC BY-SA 3.0, https://commons.wikimedia.org/w/index.php?curid=404564
1669 CE
Nicolas Steno proposes stratigraphic principles
Danish scientist Nicolas Steno formulated the principles of original horizontality, superposition, and lateral continuity of strata, founding modern stratigraphy. Source — Wikipedia:
Niels Steensen (da) - Nicholas Steno (1638 - 1686) var en pioner både indenfor anatomi og geologi. - Danish Scientist By Niels_stensen.jpg: J. P. Trap 1868 derivative work: nagualdesign (talk) - Niels_stensen.jpg, Public domain, https://commons.wikimedia.org/w/index.php?curid=18005089
1742 CE
Bourguer measures gravitational attraction
French geodesist Pierre Bouguer led an expedition to the Andes and detected gravitational attraction of mountains, laying groundwork for geophysical surveying. Source — Wikipedia:
Pierre Bouguer by Jean-Baptiste Perronneau By Jean-Baptiste Perronneau - Louvre, Public domain, https://commons.wikimedia.org/w/index.php?curid=3011865
1785 CE
Hutton presents uniformitarianism
James Hutton presented his Theory of the Earth, proposing that geological processes operate uniformly over deep time, establishing uniformitarianism as a foundational principle of geology. Source — Wikipedia:
Hutton presents uniformitarianism By Henry Raeburn - National Galleries Scotland, Public domain, https://commons.wikimedia.org/w/index.php?curid=121582412
1815 CE
William Smith publishes first geologic map
English surveyor William Smith published the first nationwide geologic map of England and Wales, demonstrating that rock strata could be identified by fossils and correlated regionally. Source — Wikipedia: )
English geologist William Smith (1769-1839), portrait by French painter Hugues Fourau (1803-1873) By Hugues Fourau - Scanned from the Geoscientist v 18, n 11, Public domain, https://commons.wikimedia.org/w/index.php?curid=5523798
1830 CE
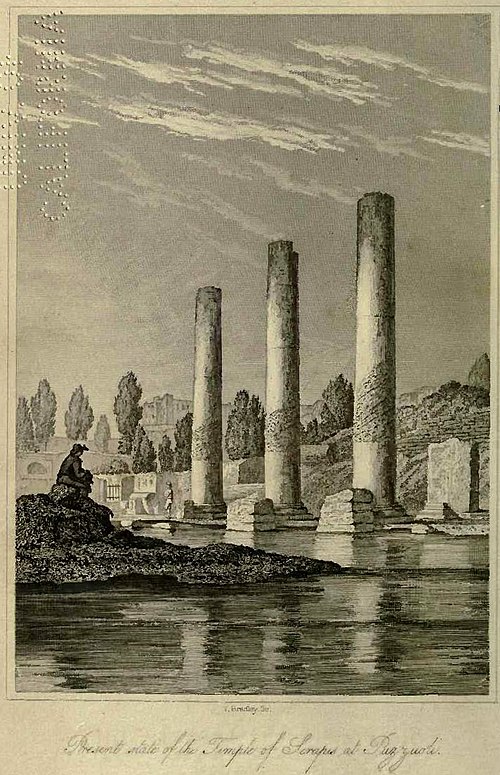
Lyell publishes Principles of Geology
Charles Lyell's Principles of Geology consolidated uniformitarianism and influenced Darwin, establishing geology as a rigorous science with deep-time reasoning. Source — Wikipedia:
Pillars of the temple at Pozzuoli (Italy) used by Lyell to show former sea level differing from today. The corroded part at each pillar has once been below sea level. This higher sea level obviously is after the temple was built and was caused by downwarp and uplift of the land surface as a result of volcanic activity. By Charles Lyell - Charles Lyell, 1832. Principles of Geology, Vol.1; frontispice, Public domain, https://commons.wikimedia.org/w/index.php?curid=7991418
1859 CE
Bunsen and Kirchhoff pioneer spectroscopic geochemistry
Robert Bunsen and Gustav Kirchhoff invented spectroscopy, enabling chemical identification of elements in minerals and volcanic gases and launching modern geochemistry. Source — Wikipedia:
Light dispersion of a mercury-vapor lamp with a prism made of flint glass By D-Kuru - Own work, CC BY-SA 3.0 at, https://commons.wikimedia.org/w/index.php?curid=7082370
1902 CE
Darcy's law formalized posthumously
Henry Darcy's 1856 work on water flow through porous media was formally recognized as Darcy's law, becoming the foundational equation of hydrogeology and groundwater flow modeling. Source — Wikipedia:
1906 CE
Oldham identifies Earth's core from seismic waves
Richard Dixon Oldham used seismic wave data to demonstrate Earth's core, distinguishing P-waves, S-waves, and establishing seismology as a tool for probing Earth's interior. Source — Wikipedia:
Richard Dixon Oldham (1858 - 1936), English geologist and seismologist By Unknown author - Original on Roger Bilham's earthquake-site, Public domain, https://commons.wikimedia.org/w/index.php?curid=1845055
1912 CE
Wegener proposes continental drift
German meteorologist Alfred Wegener proposed continental drift, arguing that continents had once formed a supercontinent called Pangaea, revolutionizing tectonic theory despite initial rejection. Source — Wikipedia:
1928 CE
Mohorovičić discontinuity discovered
Croatian seismologist Andrija Mohorovičić identified a seismic velocity discontinuity marking the boundary between Earth's crust and mantle, now called the Moho. Source — Wikipedia:
Diagram of the geological process of subduction. By KDS4444 - Own work, CC BY-SA 4.0, https://commons.wikimedia.org/w/index.php?curid=49035989
1935 CE
Richter scale developed
Charles Richter and Beno Gutenberg developed the local magnitude scale for quantifying earthquake energy, standardizing seismological measurement worldwide. Source — Wikipedia:
May 22, 1960 CE
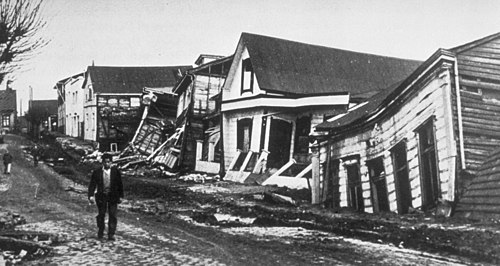
Great Chilean earthquake and tsunami
The M9.5 Valdivia earthquake, the largest ever recorded, provided critical data on megathrust ruptures and inspired global tsunami warning systems. Source — Wikipedia:
Earthquake damage to good quality, wood-frame houses in Valdivia, Chile, 1960. By Pierre St. Amand - NGDC Natural Hazards Slides with Captions Header, Public domain, https://commons.wikimedia.org/w/index.php?curid=630576
1962 CE
Hess proposes seafloor spreading
Harry Hess proposed that new oceanic crust forms at mid-ocean ridges and spreads outward, providing the mechanism for continental drift and founding plate tectonic theory. Source — Wikipedia:
Visually accessible global maps of oceanic plate age designed for color-blind readers by Fabio Crameri and shared openly via https://s-ink.org/oceanic-plate-age-poster . Highlighted are subduction zones (wide black lines) and other plate boundaries (thin black lines). Plate ages range from 0 (depicted in light colours) to approximately 200 Million years (depicted in dark colours), illustrating the dynamic process of ongoing plate motion and recycling through ocean-plate tectonics. This comprehensive representation is based on global oceanic plate age data from Müller et al. (1997), visualised on a custom Interrupted Mollweide map projection developed by Crameri et al. (2020a), with a specific focus on the world’s oceans. The ‘batlow‘ Scientific color map (Crameri et al., 2020b) ensures accurate data representation and inclusivity for all readers. Müller, R. D., et al. (1997). “Digital isochrons of the world’s ocean floor.” J. Geophys. Res. 102(B2): 3211-3214. Crameri, F., V. Magni, M. Domeier, G.E. Shephard, K. Chotalia, G. Cooper, C. Eakin, A.G. Grima, D. Gürer, A. Király, E. Mulyukova, K. Peters, B. Robert, and M. Thielmann (2020a), A transdisciplinary and community-driven database to unravel subduction zone initiation, Nature Communications, 11, 3750. doi:10.1038/s41467-020-17522-9 Crameri, F., G.E. Shephard, and P.J. Heron (2020b), The misuse of colour in science communication, Nature Communications, 11, 5444. doi:10.1038/s41467-020-19160-7 By FCrameri - Own work, CC BY-SA 4.0, https://commons.wikimedia.org/w/index.php?curid=141068006
1963 CE
Vine-Matthews magnetic anomaly confirmation
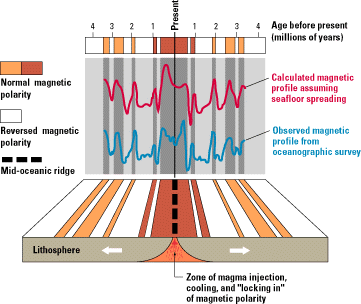
Fred Vine and Drummond Matthews correlated magnetic striping patterns on the seafloor with geomagnetic reversals, providing decisive evidence for seafloor spreading and plate tectonics. Source — Wikipedia:
A comparison of the observed magnetic profile for the seafloor across the East Pacific Rise against a profile calculated from the Earth's known magnetic reversals, assuming a constant rate of spreading. Original caption: "An observed magnetic profile (blue) for the ocean floor across the East Pacific Rise is matched quite well by a calculated profile (red) based on the Earth's magnetic reversals for the past 4 million years and an assumed constant rate of movement of ocean floor away from a hypothetical spreading center (bottom). The remarkable similarity of these two profiles provided one of the clinching arguments in support of the seafloor spreading hypothesis." By W. Jacquelyne Kious and Robert I. Tilling - Web page, image. From This Dynamic Earth: The Story of Plate Tectonics (online edition), by W. Jacquelyne Kious and Robert I. Tilling., Public domain, https://commons.wikimedia.org/w/index.php?curid=37706730
1968 CE
Isacks, Oliver, and Sykes formalize plate tectonics
Bryan Isacks, Jack Oliver, and Lynn Sykes published a synthesis linking global seismicity to plate boundaries, completing the plate tectonics revolution. Source — Wikipedia:
Map of Earth's principal tectonic plates. Plate boundary types: Divergent: Spreading center Extension zone Convergent: Subduction zone Collision zone Transform: Dextral transform Sinistral transform By M.Bitton - Own work based on: Hasterok, Derrick (8 June 2022). New maps of global geological provinces and tectonic plates. American Institute of Physics - Phys.org. Retrieved on 27 March 2023., CC BY-SA 3.0, https://commons.wikimedia.org/w/index.php?curid=130076176
1971 CE
Urey and geochemistry of oxygen isotopes
Harold Urey's work on oxygen isotope fractionation in carbonates established isotope geochemistry as a tool for paleoclimate reconstruction, earning him the Nobel Prize. Source — Wikipedia:
Harold Urey, Nobel Prize for Chemistry, 1934. For more information or additional images, please contact 202-586-5251. By Flickr: ENERGY.GOV - Unknown photographer. Restored by Creator:Adam Cuerden - HD.3F.004, Public domain, https://commons.wikimedia.org/w/index.php?curid=178710250
May 18, 1980 CE
Mount St. Helens eruption transforms volcanology
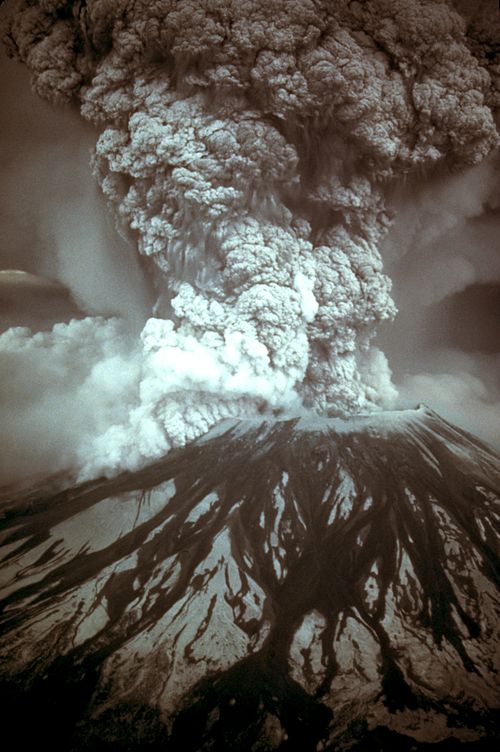
The catastrophic eruption of Mount St. Helens in Washington state, closely monitored by the USGS, advanced understanding of volcanic debris avalanches and eruption prediction. Source — Wikipedia:
On May 18, 1980, at 8:32 a.m. Pacific Daylight Time, a magnitude 5.1 earthquake shook Mount St. Helens. The bulge and surrounding area slid away in a gigantic rockslide and debris avalanche, releasing pressure, and triggering a major pumice and ash eruption of the volcano. Thirteen-hundred feet (400 meters) of the peak collapsed or blew outwards. As a result, 24 square miles (62 square kilometers) of valley was filled by a debris avalanche, 250 square miles (650 square kilometers) of recreation, timber, and private lands were damaged by a lateral blast, and an estimated 200 million cubic yards (150 million cubic meters) of material was deposited directly by lahars (volcanic mudflows) into the river channels. Fifty-seven people were killed or are still missing. USGS Photograph taken on May 18, 1980, by Austin Post. By Austin Post - Huge tif converted to jpeg and caption from USGS Mount St. Helens, Washington May 18, 1980 Eruption Images, Public domain, https://commons.wikimedia.org/w/index.php?curid=3157557
Jun 15, 1991 CE
Pinatubo eruption and global climate impact
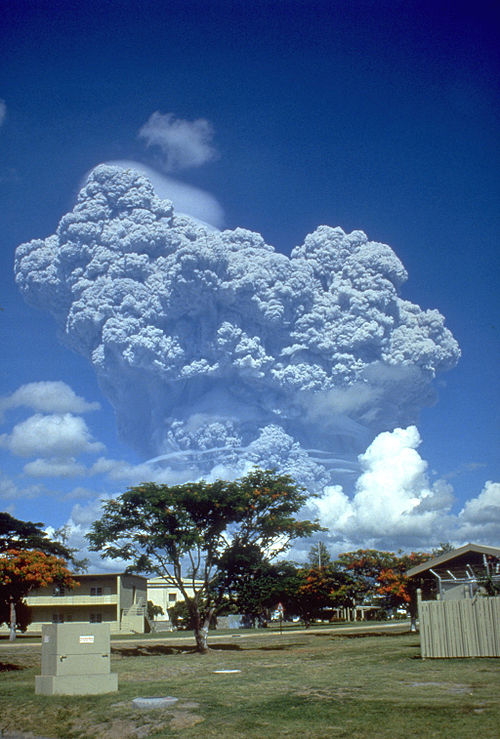
The eruption of Mount Pinatubo in the Philippines injected massive sulfur dioxide into the stratosphere, temporarily cooling global temperatures and demonstrating volcano-climate interactions. Source — Wikipedia:
Der Pinatubo Ausbruch am 12. Juni 1991, gesehen von der Clark Air Base, etwa 40 km östlich des Vulkangipfels. Copyright info: http://vulcan.wr.usgs.gov/Photo/copyright_info.html By Richard P. Hoblitt, USGS - U.S. Geological Survey., Public domain, https://commons.wikimedia.org/w/index.php?curid=26865795
2003 CE
GRACE satellites measure groundwater depletion
NASA's GRACE satellite mission enabled global monitoring of terrestrial water storage changes, revealing major groundwater depletion in aquifers worldwide. Source — Wikipedia:
Artist's concept of the Gravity Recovery and Climate Experiment spacecraft. By NASA - https://science.nasa.gov/toolkits/spacecraft-icons (image link), Public domain, https://commons.wikimedia.org/w/index.php?curid=58302513
Dec 26, 2004 CE
Indian Ocean tsunami advances warning systems
The devastating Indian Ocean tsunami, triggered by a M9.1 megathrust earthquake off Sumatra, prompted creation of the Indian Ocean Tsunami Warning System and global seismic network expansion. Source — Wikipedia:
Indian Ocean (Jan. 2, 2005) – A village near the coast of Sumatra lies in ruins after the Tsunami that struck South East Asia. Helicopters assigned to Carrier Air Wing Two (CVW-2) and Sailors from USS Abraham Lincoln (CVN 72) are conducting humanitarian operations in the wake of the Tsunami that struck South East Asia. The Abraham Lincoln Carrier Strike Group is currently operating in the Indian Ocean off the waters of Indonesia and Thailand. (South-West suburb of Banda Aceh, Indonesia. Village of Lampisang is visible in the upper-right corner) U.S. Navy photo by Photographer's Mate 2nd Class Philip A. McDaniel (RELEASED) By U.S. Navy photo by Photographer's Mate 2nd Class Philip A. McDaniel - This image was released by the United States Navy with the ID 050102-N-9593M-040 (next). This tag does not indicate the copyright status of the attached work. A normal copyright tag is still required. See Commons:Licensing. العربية ∙ বাংলা ∙ Bahaso Jambi ∙ Deutsch ∙ Deutsch (Sie-Form) ∙ English ∙ español ∙ euskara ∙ فارسی ∙ français ∙ italiano ∙ 日本語 ∙ 한국어 ∙ македонски ∙ മലയാളം ∙ Plattdüütsch ∙ Nederlands ∙ polski ∙ پښتو ∙ português ∙ русский ∙ slovenščina ∙ svenska ∙ Türkçe ∙ українська ∙ 简体中文 ∙ 繁體中文 ∙ +/−, Public domain, https://commons.wikimedia.org/w/index.php?curid=8241767
Mar 11, 2011 CE
Tohoku earthquake redefines megathrust hazards
The M9.0 Tohoku earthquake and tsunami in Japan revealed that giant earthquakes could occur in subduction zones previously thought lower risk, reshaping seismic hazard assessment globally. Source — Wikipedia:
An SH-60F helicopter assigned to the Chargers of Helicopter Antisubmarine Squadron (HS) 14 from Naval Air Facility Atsugi flies over the port of Sendai to deliver more than 1,500 pounds of food to survivors of an 9.0 magnitude earthquake and a tsunami (2011 Tōhoku earthquake and tsunami). The citizens of Ebina City, Japan, donated the food, and the U.S. Military provided earthquake and tsunami relief support. By U.S. Navy photo - This image was released by the United States Navy with the ID 110312-N-0000X-003 (next). This tag does not indicate the copyright status of the attached work. A normal copyright tag is still required. See Commons:Licensing. العربية ∙ বাংলা ∙ Bahaso Jambi ∙ Deutsch ∙ Deutsch (Sie-Form) ∙ English ∙ español ∙ euskara ∙ فارسی ∙ français ∙ italiano ∙ 日本語 ∙ 한국어 ∙ македонски ∙ മലയാളം ∙ Plattdüütsch ∙ Nederlands ∙ polski ∙ پښتو ∙ português ∙ русский ∙ slovenščina ∙ svenska ∙ Türkçe ∙ українська ∙ 简体中文 ∙ 繁體中文 ∙ +/−, Public domain, https://commons.wikimedia.org/w/index.php?curid=14585877
2024 CE
China's FAST aids geophysical and planetary research
China's Five-hundred-meter Aperture Spherical Telescope (FAST), while primarily astronomical, contributes to radar studies of near-Earth objects and planetary geophysics, extending geoscience tools into space. Source — Wikipedia:
500m Aperture Spherical Radio Telescope located in Guizhou Province, China By SCJiang - Own work, CC BY-SA 4.0, https://commons.wikimedia.org/w/index.php?curid=172271062