Encyclopedia/1. The Cosmos & The Natural World/4. Earth Sciences/02. Meteorology & Climate Science • Curated by Admin Timeline.sg
Atmospheric chemistry · Paleoclimatology · Space weather
Chronological Storyline (32 Milestones)
1700 BCE
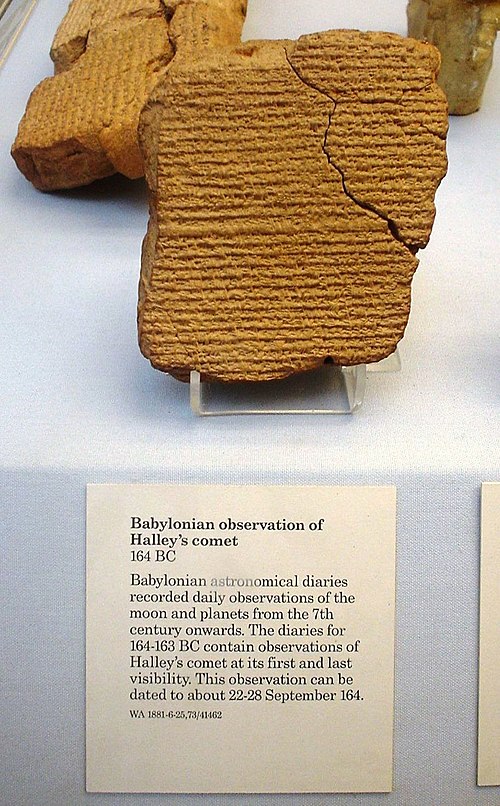
Babylonian weather omens recorded
Babylonian scholars recorded atmospheric phenomena such as rain, thunder, and cloud patterns on cuneiform tablets, linking weather observations to omen interpretation and laying groundwork for systematic weather recording. Source — Wikipedia:
A Babylonian tablet recording Halley's comet during an appearance in 164 BC. At the British Museum in London By The original uploader was Linguica at English Wikipedia. - Transferred from en.wikipedia to Commons by Calliopejen1 using CommonsHelper., Public domain, https://commons.wikimedia.org/w/index.php?curid=17674029
1200 BCE
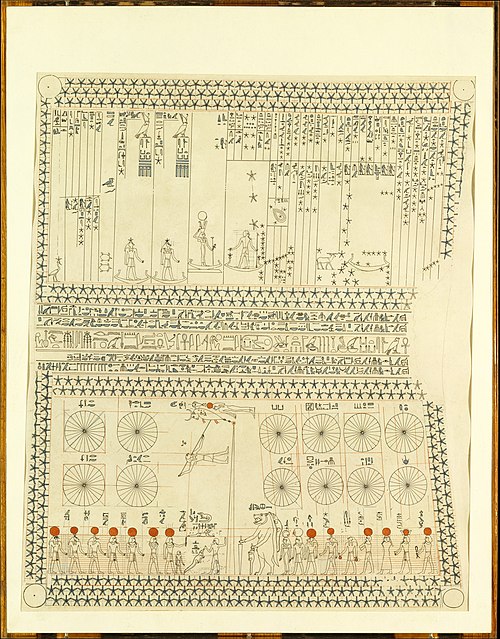
Egyptian meteorological observations
Egyptian priests tracked seasonal Nile flooding and associated weather patterns, creating one of the earliest systematic records linking atmospheric and hydrological cycles to agriculture. Source — Wikipedia:
Facsimile, Senenmut (TT 353), astronomical ceiling By Charles Wilkinson - This file was donated to Wikimedia Commons as part of a project by the Metropolitan Museum of Art. See the Image and Data Resources Open Access Policy, CC0, https://commons.wikimedia.org/w/index.php?curid=65139468
300 BCE
Aristotle writes Meteorologica
Aristotle's text systematically described atmospheric phenomena including clouds, rain, wind, and weather, establishing the philosophical framework for meteorology in the West for nearly two millennia. Source — Wikipedia: )
Meteorolo. Tomus sextus operum Aristotelis Stagiritae, Peripateticorum principis, naturalis eam phylosophiae adferens sectionem, quae ad meteorologicorum, seu sublimium corporum, & vegetabilium quidditates species, & passiones, animalium vero historiam, partes, & incessum spectare dignoscitur .... - Venetiis : [al segno della Fontana], 1560 (Venetiis : apud Cominum de Tridino Montisferrati : [al segno della Fontana]) By Meteorolo - Available in the BEIC digital library and uploaded in partnership with BEIC Foundation., Public domain, https://commons.wikimedia.org/w/index.php?curid=36512770
250 BCE
Chinese systematic weather records begin
Chinese officials began maintaining systematic records of weather, rainfall, and seasonal phenomena, establishing a tradition of state-sponsored meteorological observation that continued for centuries. Source — Wikipedia:
Towering cumulonimbus and other clouds are spotted during a pass over the Earth by the Expedition 48 crew aboard the International Space Station. Photographs from the station provides researchers on Earth with key data to understand the planet from the perspective of the ISS. Crew members have been photographing Earth from space since the early Mercury missions beginning in 1961. The images taken from the ISS ensure this record remains unbroken. By NASA - https://www.flickr.com/photos/nasa2explore/28649049831/, Public domain, https://commons.wikimedia.org/w/index.php?curid=50471098
50 CE
Liu Xin documents atmospheric optics
Chinese scholar Liu Xin and contemporaries recorded detailed observations of atmospheric optical phenomena including halos and parhelia, contributing to early understanding of light interaction with atmospheric ice crystals. Source — Wikipedia:
Aftermath of the California 2007 wildfires: Witch Creek Fire, San Diego County. Smoke remains in the air long after the fires have been extinguished. The visible effect at twilight is unusually brilliant tones in the fading sky, but the stench is overpowering. This is a retouched picture, which means that it has been digitally altered from its original version. Modifications: Denoising by Lycaon. By Durova - Own work, Public domain, https://commons.wikimedia.org/w/index.php?curid=3314037
132 CE
Zhang Heng invents seismoscope
Zhang Heng invented a seismoscope that detected distant earthquakes, demonstrating Chinese advances in measuring geophysical events and indirectly advancing understanding of atmospheric-acoustic coupling. Source — Wikipedia:
Tomb of Zhang Heng By Windmemories - Own work, CC BY-SA 4.0, https://commons.wikimedia.org/w/index.php?curid=176246974
550 CE
Varahamihira compiles Brihat Samhita
Indian scholar Varahamihira compiled the Brihat Samhita, which contained detailed chapters on meteorology, the monsoon, seasonal rainfall patterns, and atmospheric phenomena, integrating astronomy with weather science. Source — Wikipedia:
850 CE
Al-Kindi writes on meteorology
Arab polymath al-Kindi wrote treatises on atmospheric phenomena including winds, clouds, and weather prediction, advancing Islamic meteorology within the broader House of Wisdom scholarly tradition. Source — Wikipedia:
An Iraqi postage stamp of 6 money issued in 1962 on the occasion of the millennium anniversary of the founding of the city of Baghdad and in memory of the philosopher Yacoub bin Ishaq Al-Kindi. By Iraqi Post - Personal collection, Public domain, https://commons.wikimedia.org/w/index.php?curid=91832934
900 CE
Al-Battani refines atmospheric refraction
Arab astronomer al-Battani made precise measurements of atmospheric refraction affecting astronomical observations, recognizing that Earth's atmosphere bends light from celestial bodies. Source — Wikipedia:
Latin 7266; folio 78r (BnF) By unknown, copied from a work by Al-Battani - https://gallica.bnf.fr/ark:/12148/btv1b52505729k/f161.item.zoom# - a Latin translation of al-Battani's work Kitāb az-Zīj aṣ-Ṣābi’, CC BY-SA 4.0, https://commons.wikimedia.org/w/index.php?curid=128222946
1040 CE
Shen Kuo discovers magnetic declination
Chinese polymath Shen Kuo documented that a magnetic compass needle pointed slightly east of true north, discovering magnetic declination—a finding foundational to understanding geomagnetism and later space weather connections. Source — Wikipedia:
Exhibition description: Shen Kuo (1031-1095 AD) A prominent scientist and astrononmer of the Song Dynasty. Shen Kuo was the head official of the Bureau of Astronomy in the Song court, where he improved the design of several local astronomical instruments, including the amillary aphere, the gnomon and the clepsydra clock. He also formulated a solar calendar named the Twelve Solar Terms Calendar, which was used in agriculture. His work are summed up in his Dream Pool Essays, one of the greatest books of that time. By Hans A. Rosbach - Own work, CC BY-SA 3.0, https://commons.wikimedia.org/w/index.php?curid=89508454
1088 CE
Shen Kuo records climate change evidence
Shen Kuo described fossilized bamboo found in northern China, inferring that the region's climate had once been warmer and wetter, constituting an early paleoclimatological observation. Source — Wikipedia:
Exhibition description: Shen Kuo (1031-1095 AD) A prominent scientist and astrononmer of the Song Dynasty. Shen Kuo was the head official of the Bureau of Astronomy in the Song court, where he improved the design of several local astronomical instruments, including the amillary aphere, the gnomon and the clepsydra clock. He also formulated a solar calendar named the Twelve Solar Terms Calendar, which was used in agriculture. His work are summed up in his Dream Pool Essays, one of the greatest books of that time. By Hans A. Rosbach - Own work, CC BY-SA 3.0, https://commons.wikimedia.org/w/index.php?curid=89508454
1441 CE
Korean Cheugugi rain gauge invented
King Sejong's court in Joseon Korea invented the Cheugugi, the world's first standardized rain gauge, enabling systematic quantitative measurement of precipitation for agricultural planning. Source — Wikipedia:
Jang Yeong-sil Science Garden in Busan commemorates the achievements of one of the greatest scientists of Joseon. The Rain Gauges are instruments to measure rain fall. The rain gauge is Treasure #842. By Steve46814 - Own work, CC BY-SA 3.0, https://commons.wikimedia.org/w/index.php?curid=32668697
1607 CE
Galileo constructs thermoscope
Galileo Galilei constructed an early thermoscope, a precursor to the thermometer, enabling the first quantitative measurements of atmospheric temperature changes. Source — Wikipedia:
instrument Musée des Arts et Métiers By Chatsam - Own work, CC BY-SA 3.0, https://commons.wikimedia.org/w/index.php?curid=35923048
1643 CE
Torricelli invents barometer
Evangelista Torricelli invented the mercury barometer, demonstrating that Earth's atmosphere has weight and pressure and founding the science of atmospheric pressure measurement. Source — Wikipedia:
Torricelli invents barometer By Unknown author, CC BY-SA 3.0, https://commons.wikimedia.org/w/index.php?curid=295309
1662 CE
Boyle's Law relates pressure and volume
Robert Boyle established that gas pressure is inversely proportional to volume at constant temperature, providing a fundamental physical law governing atmospheric gases. Source — Wikipedia:
An animation of Boyle's Law, showing the relationship between volume and pressure when gas mass and temperature are held constant. By NASA's Glenn Research Center - http://www.grc.nasa.gov/WWW/K-12/airplane/aboyle.html, Public domain, https://commons.wikimedia.org/w/index.php?curid=4448761
1742 CE
Celsius proposes temperature scale
Anders Celsius proposed a centigrade temperature scale, standardizing atmospheric temperature measurement and enabling consistent global climate record-keeping. Source — Wikipedia:
Headshot of Anders Celsius By Olof Arenius - https://richardnilsendotcom1.files.wordpress.com/2013/03/anders_celsius.jpg as thumbnailed by https://richardnilsen.com/2013/03/18/the-measure-of-humankind/, Public domain, https://commons.wikimedia.org/w/index.php?curid=60390366
1783 CE
Cavendish analyzes atmospheric composition
Henry Cavendish determined that air is a mixture of nitrogen and oxygen with small amounts of other gases, establishing the chemical composition of the atmosphere. Source — Wikipedia:
Picture and signature of the noted natural philosopher, Henry Cavendish By George Wilson - Frontispiece of The Life of the Hon. Henry Cavendish, Public domain, https://commons.wikimedia.org/w/index.php?curid=7373371
1804 CE
Gay-Lussac measures upper atmosphere
Joseph Louis Gay-Lussac ascended to 7,000 meters in a balloon, taking air samples and temperature readings that revealed how atmospheric conditions change with altitude. Source — Wikipedia:
Portrait of Joseph Louis Gay-Lussac, French physicist and chemist By François-Séraphin Delpech - chemistryland.com, Public domain, https://commons.wikimedia.org/w/index.php?curid=91658
1815 CE
Tambora eruption triggers climate anomaly
The eruption of Mount Tambora in Indonesia injected massive sulfur dioxide into the stratosphere, causing the 1816 'Year Without a Summer' and demonstrating volcanic forcing of climate. Source — Wikipedia:
1816 summer temperature anomaly (°C) with respect to 1971-2000 climatology. Data source:ftp://ftp.ncdc.noaa.gov/pub/data/paleo/historical/europe-seasonal-files/ By Giorgiogp2 - Own work, CC BY-SA 3.0, https://commons.wikimedia.org/w/index.php?curid=8942703Indonesia's Pompeii: Mount Tambora - The Full Documentary
1816 CE
Agassiz proposes ice age theory
Louis Agassiz presented evidence that vast ice sheets once covered Europe, founding paleoclimatology by demonstrating Earth's climate has undergone dramatic historical changes. Source — Wikipedia:
Louis Agassiz (1807-1873), Carte de Visite By William Shaw Warren - [1], Public domain, https://commons.wikimedia.org/w/index.php?curid=16445252
1860 CE
Tyndall discovers greenhouse gas effect
John Tyndall demonstrated experimentally that water vapor and carbon dioxide absorb infrared radiation, discovering the physical basis of the greenhouse effect. Source — Wikipedia:
John Tyndall, Irish physicist, in mid-career By Tucker Collection - New York Public Library Archives, Public domain, https://commons.wikimedia.org/w/index.php?curid=16242657John Tyndall: The Physicist Who Proved the Greenhouse Effect - with Paul Hurley
1896 CE
Arrhenius quantifies CO2 climate impact
Svante Arrhenius calculated that doubling atmospheric CO2 would raise global temperatures by 5-6 degrees Celsius, producing the first quantitative estimate of greenhouse warming. Source — Wikipedia:
Svante Arrhenius (* 19. Februar 1859 auf Gut Wik bei Uppsala; † 2. Oktober 1927 in Stockholm) By Photogravure Meisenbach Riffarth & Co. Leipzig. - Zeitschrift für Physikalische Chemie, Band 69, 1909., Public domain, https://commons.wikimedia.org/w/index.php?curid=96273
1902 CE
Teisserenc de Bort discovers stratosphere
Léon Teisserenc de Bort discovered the stratosphere through balloon-borne instrument flights, revealing that the atmosphere has a layered thermal structure. Source — Wikipedia:
French meteorologist Léon Teisserenc de Bort (1855-1913) By Unknown author - [1], Public domain, https://commons.wikimedia.org/w/index.php?curid=2595020
1924 CE
Milankovitch publishes orbital cycle theory
Milutin Milanković published his theory that long-term variations in Earth's orbit drive ice age cycles, providing a foundational mechanism for paleoclimatic change. Source — Wikipedia:
Orbital Parameters for the Earth: http://aom.giss.nasa.gov/srorbpar.html Insolation calculation is generated from the orbital parameters Vostok ice core data: Petit, J.R., et al., 2001, Vostok Ice Core Data for 420,000 Years, IGBP PAGES/World Data Center for Paleoclimatology Data Contribution Series #2001-076. NOAA/NGDC Paleoclimatology Program, Boulder CO, USA. ftp://ftp.ncdc.noaa.gov/pub/data/paleo/icecore/antarctica/vostok/deutnat.txt Temperature reconstruction is offered within the dataset. Benthic foram data: Lisiecki, L. E., and M. E. Raymo (2005), A Pliocene- Pleistocene stack of 57 globally distributed benthic d18O records, Paleoceanography,20, PA1003, doi:10.1029/2004PA001071. http://lorraine-lisiecki.com/stack.html A definitive temperature reconstruction is not offered within the data set. But from: http://lorraine-lisiecki.com/thesis_appendix.html#2-Appendix-B-The-d18O-of-Foraminifera is the statement: "A large portion change in d18Oc records is thought to result of the sequestration of isotopically light oxygen (16O) in large continental ice sheets, resulting in ocean water that has a larger proportion of 18O." Thus reduction of oxygen 18 (which is upward on the graph) indicates warmer conditions and higher sealevel. By Incredio - Own work, CC BY 3.0, https://commons.wikimedia.org/w/index.php?curid=6930545
1925 CE
Appleton discovers ionosphere
Edward Appleton discovered the ionized layer of the upper atmosphere now called the ionosphere, establishing the link between solar radiation and atmospheric ionization central to space weather. Source — Wikipedia:
Sir Edward Victor Appleton By Nobel foundation - http://nobelprize.org/nobel_prizes/physics/laureates/1947/appleton-bio.html, Public domain, https://commons.wikimedia.org/w/index.php?curid=6183014
1958 CE
Keeling begins CO2 monitoring
Charles David Keeling began continuous atmospheric CO2 measurements at Mauna Loa Observatory, producing the Keeling Curve that documented the steady rise in greenhouse gases. Source — Wikipedia:
This figure shows the history of atmospheric carbon dioxide concentrations as directly measured at Mauna Loa, Hawaii since 1958. This curve is known as the Keeling curve, and is an essential piece of evidence of the man-made increases in greenhouse gases that are believed to be the cause of global warming. The longest such record exists at Mauna Loa, but these measurements have been independently confirmed at many other sites around the world [1]. The annual fluctuation in carbon dioxide is caused by seasonal variations in carbon dioxide uptake by land plants. Since many more forests are concentrated in the Northern Hemisphere, more carbon dioxide is removed from the atmosphere during Northern Hemisphere summer than Southern Hemisphere summer. This annual cycle is shown in the inset figure by taking the average concentration for each month across all measured years. The red curve shows the average monthly concentrations, and blue curve is a smoothed trend. By Oeneis - Own work. Data from Dr. Pieter Tans, NOAA/ESRL and Dr. Ralph Keeling, Scripps Institution of Oceanography., CC BY-SA 4.0, https://commons.wikimedia.org/w/index.php?curid=40636957The Keeling Curve Turns 50
1958 CE
Van Allen belts discovered
James Van Allen discovered Earth's radiation belts using instruments on Explorer 1, revealing that the planet's magnetic field traps energetic particles—a key discovery for space weather science. Source — Wikipedia:
This video illustrates changes in the Van Allen belts shape and intensity. By NASA/Goddard Space Flight Center - Goddard Multimedia, Public domain, https://commons.wikimedia.org/w/index.php?curid=20340558
1974 CE
Rowland and Molina warn of ozone depletion
Mario Molina and F. Sherwood Rowland published research showing that CFCs deplete stratospheric ozone, founding modern atmospheric chemistry and leading to the Montreal Protocol. #contemporary #science
1985 CE
Antarctic ozone hole discovered
Joe Farman and colleagues reported severe springtime ozone depletion over Antarctica, confirming CFC-driven ozone destruction and galvanizing global atmospheric protection policy. · Wikipedia: https://en.wikipedia.org/wiki/Ozone_depletion
This image shows the global (from 65 degrees north latitude to 65 degrees south latitude) monthly average total ozone amount for the time period 1979 through the end of 2001. The green line shows the results from Nimbus-7 TOMS instrument. The red line shows the results from the Meteor-3 TOMS instrument. The blue line shows the results from the Earth Probe TOMS instrument, which developed a fault in 2002. By NASA - http://toms.gsfc.nasa.gov/multi/ozone_time_series.jpg, Public domain, https://commons.wikimedia.org/w/index.php?curid=815580Discovery of the ozone hole | Natural History Museum
1992 CE
Vostok ice core reveals climate history
Analysis of the Vostok ice core in Antarctica provided a 420,000-year record of atmospheric CO2 and temperature, confirming the tight coupling between greenhouse gases and paleoclimate. Source — Wikipedia:
New wintering building at Vostok station as of summer 2023-2024 By Arctic and Antarctic Research Institute - https://documents.ats.aq/ATCM46/bp/ATCM46_bp044_e.docx, CC BY 4.0, https://commons.wikimedia.org/w/index.php?curid=156623891
2006 CE
CloudSat launches to study clouds
NASA launched the CloudSat satellite carrying a cloud-profiling radar, enabling the first global three-dimensional observations of cloud structure and advancing atmospheric science. Source — Wikipedia:
Artist's concept of the CloudSat spacecraft. By NASA - https://science.nasa.gov/toolkits/spacecraft-icons (image link), Public domain, https://commons.wikimedia.org/w/index.php?curid=58072647
2015 CE
Paris Agreement on climate
The Paris Agreement established binding commitments to limit greenhouse gas emissions, driven by decades of atmospheric science documenting human-caused climate change. Source — Wikipedia:
Signatories (yellow) and parties (blue) to the Paris Agreement Signatories Parties Withdrew Parties also covered by EU ratification By L.tak - This file uses File:Detailed Blank World Map.svg as a basis. Changes to the paths and their classes, are shown in the Changelog, which is included at the beginning of the file. Please do also update the Changelog, so that at any time the file can be updated easily if the political map (state borders) changes in the future., CC BY-SA 4.0, https://commons.wikimedia.org/w/index.php?curid=48320267The Paris Agreement: the world unites to fight climate change
![Meteorolo. Tomus sextus operum Aristotelis Stagiritae, Peripateticorum principis, naturalis eam phylosophiae adferens sectionem, quae ad meteorologicorum, seu sublimium corporum, & vegetabilium quidditates species, & passiones, animalium vero historiam, partes, & incessum spectare dignoscitur .... - Venetiis : [al segno della Fontana], 1560 (Venetiis : apud Cominum de Tridino Montisferrati : [al segno della Fontana])](https://upload.wikimedia.org/wikipedia/commons/thumb/3/37/Tomus_sextus_operum_Aristotelis_Stagiritae_V00235_00000004.tif/lossy-page1-500px-Tomus_sextus_operum_Aristotelis_Stagiritae_V00235_00000004.tif.jpg)


![This figure shows the history of atmospheric carbon dioxide concentrations as directly measured at Mauna Loa, Hawaii since 1958. This curve is known as the Keeling curve, and is an essential piece of evidence of the man-made increases in greenhouse gases that are believed to be the cause of global warming. The longest such record exists at Mauna Loa, but these measurements have been independently confirmed at many other sites around the world [1]. The annual fluctuation in carbon dioxide is caused by seasonal variations in carbon dioxide uptake by land plants. Since many more forests are concentrated in the Northern Hemisphere, more carbon dioxide is removed from the atmosphere during Northern Hemisphere summer than Southern Hemisphere summer. This annual cycle is shown in the inset figure by taking the average concentration for each month across all measured years. The red curve shows the average monthly concentrations, and blue curve is a smoothed trend.](https://upload.wikimedia.org/wikipedia/commons/thumb/c/c5/Mauna_Loa_CO2_monthly_mean_concentration.svg/500px-Mauna_Loa_CO2_monthly_mean_concentration.svg.png)


